10 Data Science Concept
10.1 Introduction
Welcome to Lab 10! In this lab, we will explore the concept of data science. Data science is both an art and a science, blending statistical thinking, programming skills, computational methods, and domain knowledge to transform raw data into actionable insights. It is the critical bridge between raw numbers and actionable knowledge in a world of information. More than just a field, data science has the potential to revolutionise how we make decisions and understand the world, showcasing its transformative power and impact.
In previous labs, you learned about organising workflows, preparing data, and creating compelling visualisations. Now, you’ll contextualise these skills within the broader realm of data science. Understanding its principles and workflows allows you to navigate complex projects with robust, reproducible, and scientifically grounded analyses.
Data science thrives at the intersection of disciplines—mathematics, statistics, computer science, and domain expertise—each contributing essential elements. This interdisciplinary nature of data science not only makes it a challenging and dynamic field but also enriches it with diverse perspectives and approaches. Whether predicting sales, detecting anomalies, recommending products, or automating decisions, data science equips you with the tools and frameworks to tackle intricate challenges. Unsurprisingly, Harvard Business Review dubbed data science the “sexiest job of the 21st century,” reflecting its importance and allure1.
10.2 Learning Objectives
By the end of this lab, you will be able to:
Define Data Science and Its Interdisciplinary Nature
Understand how data science draws upon statistics, programming, domain expertise, and communication to extract meaningful insights.Recognise Key Use Cases and Applications
Identify real-world scenarios—forecasting, pattern detection, recommendation systems—where data science delivers value.Describe the Data Science Lifecycle
Understand the phases of data science projects, from importing and tidying data through transformation, modelling, visualisation, and communication.Appreciate the Role of a Data Scientist
Recognise the diverse skill set, responsibilities, and evolving role of data scientists in modern organisations.Connect Data Science Concepts to Previous Labs
Relate data science principles to earlier labs on data wrangling, visualisation, and reproducibility, reinforcing a cohesive understanding of the end-to-end analytical workflow.
By completing Lab 10, you’ll gain a holistic understanding of what data science entails, the roles and skills of data scientists, and the typical lifecycle that guides projects from concept to actionable insights. This foundation sets the stage for integrating all the technical skills you’ve acquired into meaningful, real-world applications.
10.3 Prerequisites
Before starting this lab, you should have:
Completed previous labs (especially Labs 4, 5, 6, and 7) to be familiar with setting up reproducible workflows, transforming data, and creating visualisations.
Basic understanding of statistical concepts and programming fundamentals in R.
An interest in applying these skills to solve problems and support evidence-based decision-making.
10.4 Real-World Scenario: Data Science in Action
Consider working in a healthcare analytics team that aims to predict patient readmissions. Your data includes patient demographics, medical histories, treatment plans, and outcomes. By applying data science methods—cleaning and transforming raw hospital records, building predictive models, and communicating results to clinicians—you can help target interventions that reduce readmissions, improve patient care, and optimise resource allocation.
In this scenario, all the components of data science—technical mastery, statistical rigour, domain understanding, and effective communication—come into play. Data science thus not only solves problems but also supports better-informed strategies that can impact patient lives.
10.5 Understanding Data Science
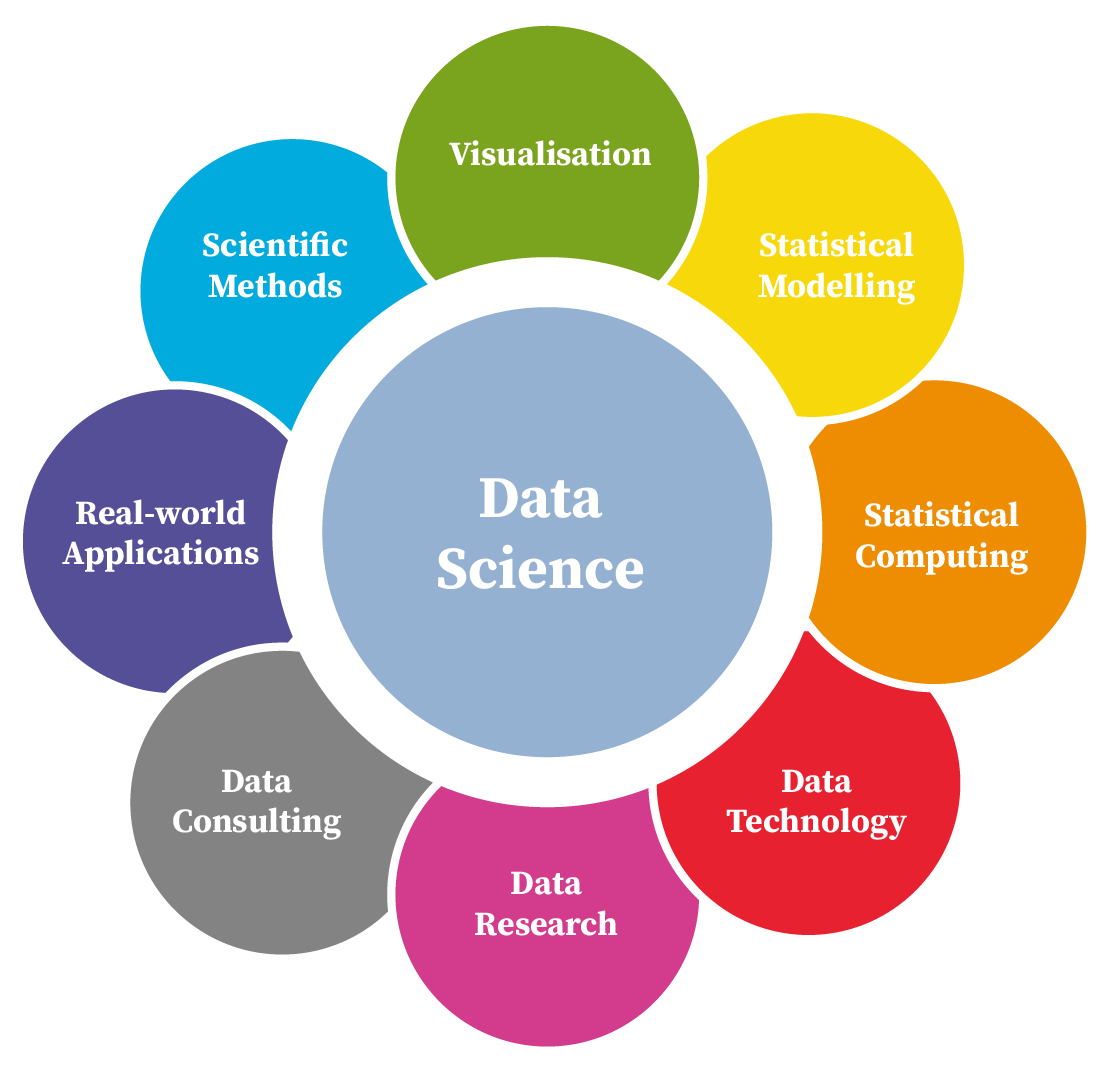
Imagine data science as a field that draws on a multitude of ideas and skills from various disciplines to solve problems and uncover insights. One way to visualise this interdisciplinary nature is shown in Figure 10.1 (a). In this diagram, ‘data science’ sits at the centre, surrounded by petals labelled ‘visualisation’, ‘statistical modelling’, ‘statistical computing’, ‘data technology’, ‘data research’, ‘data consulting’, ‘real-world applications’, and ‘scientific methods’. Each petal represents a key area or responsibility within the data science process, inspiring your interest and engagement in this dynamic field.
Another useful way to understand how these areas connect is through a Venn diagram overlapping three main circles: Mathematics/Statistics, Domain Expertise, and Computer Science/Programming, as shown in Figure 10.1 (b). At the intersection of these circles, data science draws on their collective strengths. From the mathematical side, it utilises statistical research and machine learning techniques. With domain expertise, it incorporates business- or field-specific knowledge to shape pertinent questions. And from computer science, it relies on programming and data-processing skills to manage large datasets effectively.
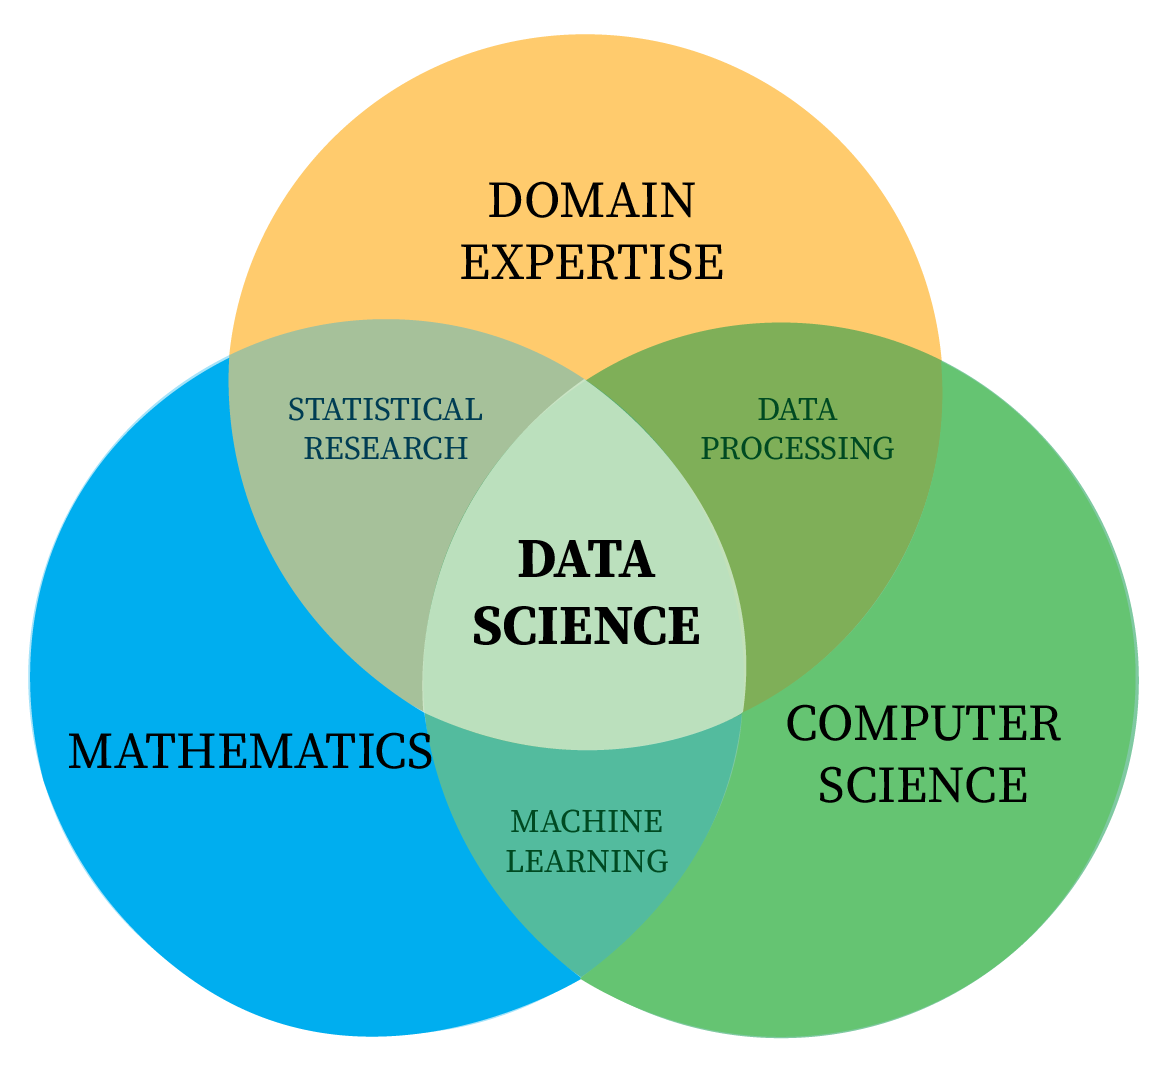
Taken together, these perspectives highlight data science as a highly collaborative and multifaceted discipline. It demands an understanding of essential concepts (such as statistical modelling and coding) and the ability to apply them to real-world challenges across numerous sectors. By mastering the overlapping skills in these areas, you can explore data, generate valuable insights, and ultimately make evidence-based decisions—demonstrating the practical impact of data science.
Reflection Question 10.1
How does integrating multiple disciplines—statistics, programming, domain expertise, communication—enable data scientists to tackle more complex questions than any single field could address alone?
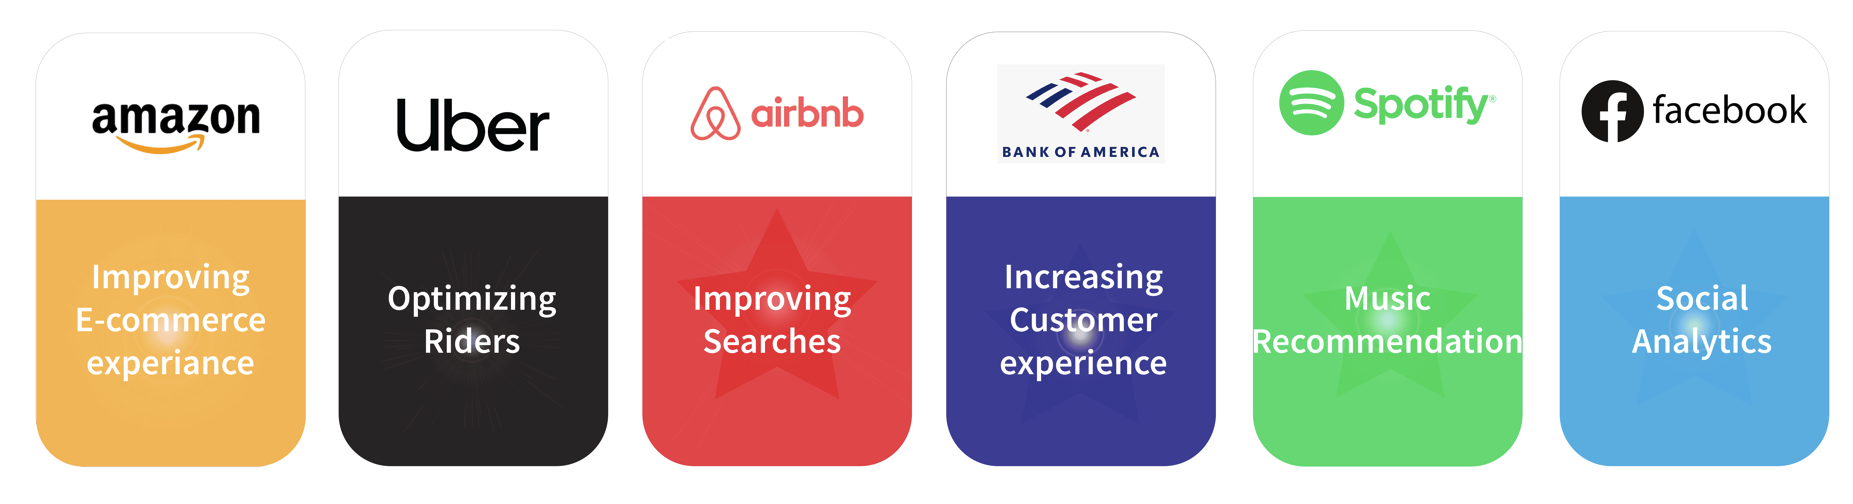
10.6 Data Science Use Cases
Data science has transformed industries by delivering innovative, data-driven solutions to complex problems:
Forecasting: Predict future sales, revenue, or retention.
Pattern Detection: Identify weather trends or detect market shifts.
Recommendations: Suggest products, content, or services.
Anomaly Detection: Spot fraudulent transactions, defects, or suspicious behaviour.
Automation and Decision-Making: Conduct background checks, assess credit, and streamline operations.
Classification: Categorise emails as spam or not, diagnose diseases, and flag phishing sites.
Recognition: Enable facial, voice, or text recognition technologies.
Reflection Question 10.2
Which data science application resonates most with your interests or field, and why might it be challenging or rewarding to implement?
10.7 Who is a Data Scientist?
A data scientist:
Collects and Organises Data: Gathers, cleans, and structures data into analysis-ready formats.
Analyses Patterns and Trends: Uses statistical and computational methods to find relationships and identify important features.
Communicates Findings: Translates complex analyses into accessible narratives and insights for decision-makers.
The best data scientists combine technical prowess, creative thinking, and strong communication skills. They must understand how to analyse data, why particular patterns matter, and effectively convey these insights.
Reflection Question 10.3
Beyond technical skills, why is communication and domain knowledge crucial for a data scientist to make meaningful contributions?
10.8 Skills Required for Data Science
A successful data scientist blends multiple competencies:
Programming: Proficiency in R, Python, and SQL.
Data Wrangling: Cleaning, merging, and transforming datasets.
Visualisation: Crafting clear, insightful charts and dashboards.
Statistical Analysis: Applying models, tests, and confidence intervals to draw inferences.
Machine Learning: Building predictive or descriptive models to uncover patterns.
Communication: Presenting results in understandable, persuasive forms.
Domain Expertise: Understanding the context and constraints that shape data interpretation.
Reflection Question 10.4
Which skill area do you feel is your strongest currently, and where do you see room for the most improvement?
10.9 Becoming a Data Scientist
The path to becoming a data scientist involves the following:
Learn Programming Languages: Start with R for statistical analysis and Python for broader machine learning tasks.
Build Real-World Projects: Apply your skills to real datasets, refining your approach as you encounter practical challenges.
Master Statistics and Mathematics: Develop a solid foundation to ensure robust model selection, validation, and interpretation.
Engage in Collaboration: Join communities, attend meetups, and participate in hackathons. Seek mentorship to broaden your horizons.
Continuous Learning: Data science evolves rapidly; staying updated with new tools, algorithms, and best practices is essential.
Reflection Question 10.5
In your journey towards becoming a data scientist, how will you balance pursuing technical skills with developing communication and domain-specific expertise?
10.10 Programming Languages for Data Science
R, Python, Julia, and Scala are popular choices in data science, each excelling in different areas. R is renowned for statistical analysis and rich visualisation capabilities—ideal for academic research and analytic prototyping. Python offers versatility and a vast ecosystem of libraries for machine learning and deep learning tasks.

Reflection Question 10.6
Considering your goals and project types, which programming language do you find most appealing, and why?
10.11 The Data Science Lifecycle
Data science workflows are iterative, often cycling through exploration, modelling, and refinement phases, usually following six key stages, as shown in Figure 10.4.
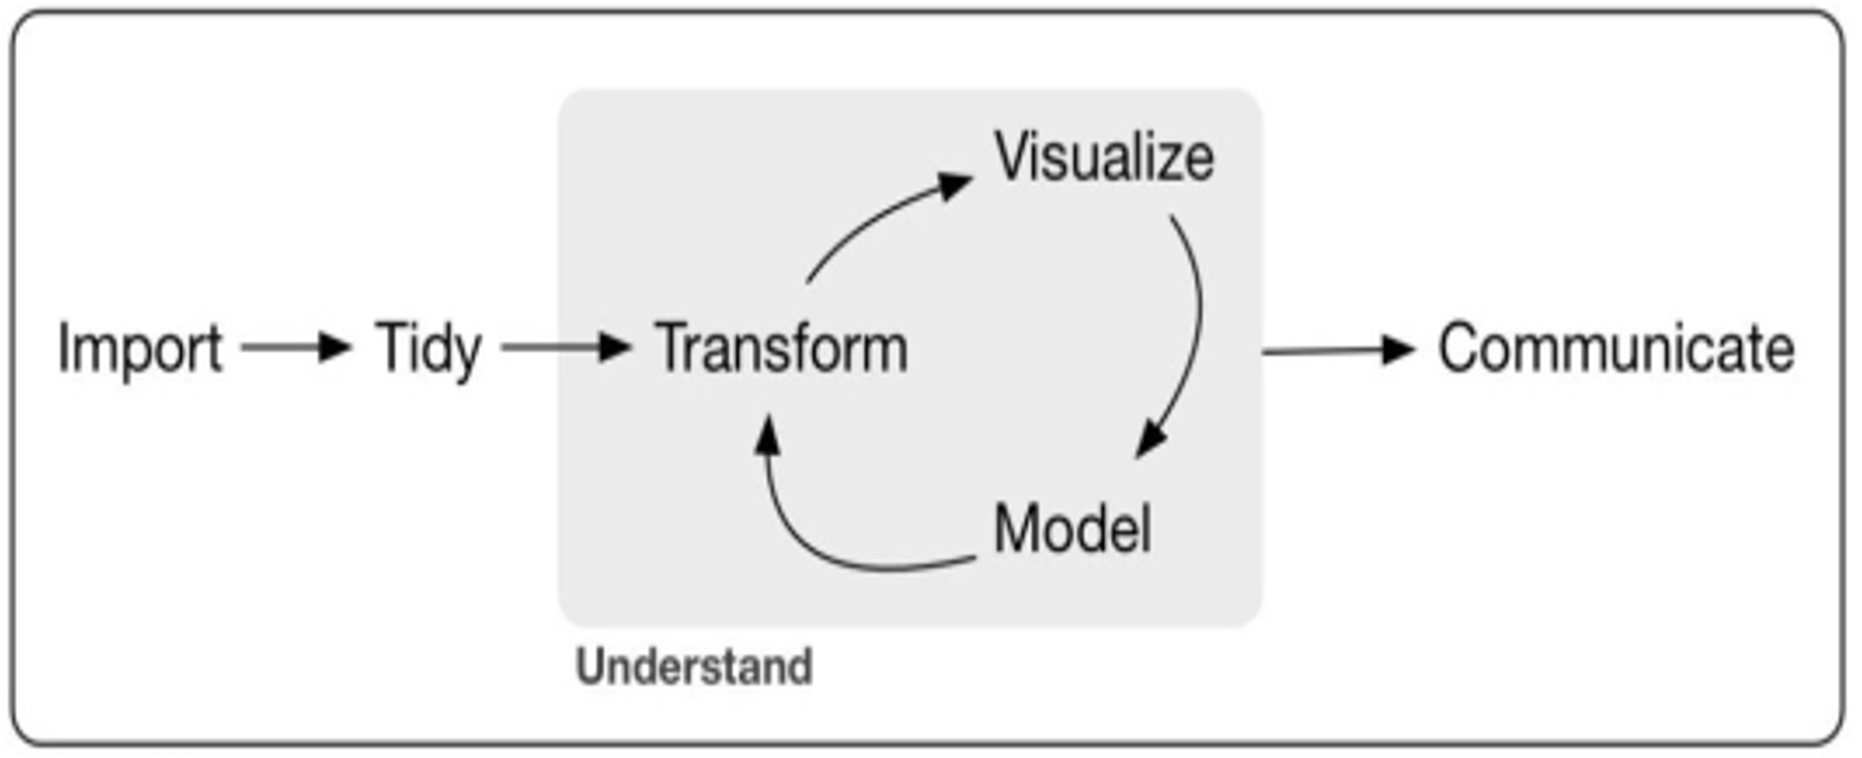
10.11.1 Import
Importing data into appropriate tools, such as R, Python, or spreadsheet software like Microsoft Excel, is the starting point of any data science project. This step provides the raw materials for all subsequent stages—without data, there is no data science.
10.11.2 Tidy
Tidying data is one of data scientists’ most time-consuming yet essential tasks. Real-world datasets are often messy and unstructured, requiring careful organisation into a format suitable for analysis.
The principle of tidy data ensures that:
Columns represent variables.
Rows represent observations.
Cells contain individual values.
This process, often called data wrangling or munging, is a critical foundation for successful analysis.
10.11.3 Transform
Data transformation is another integral part of data wrangling. This involves creating new variables or modifying existing ones to uncover patterns, relationships, or trends. Transformation helps refine the data into a format that aligns with the project’s analytical goals.
10.11.4 Visualise
Visualisation bridges raw data and actionable insights using charts, graphs, and interactive dashboards. Tools like ggplot2 in R make this process intuitive and effective.
10.11.5 Models
Modelling applies statistical techniques or machine learning algorithms to answer questions or make predictions. For example:
Linear Regression: Predicting housing prices.
Classification Models: Identifying spam emails. Proficiency in coding and a solid understanding of statistical methods are critical for interpreting and validating models.
10.11.6 Communicate
Effective communication is the final and most critical stage of the data science workflow. Insights must be presented clearly and persuasively to stakeholders, ensuring they can make informed decisions based on the findings. Tools like Quarto or R Markdown facilitate professional-grade reports.
Reflection Question 10.7
How does viewing data analysis as a cyclical lifecycle (rather than a linear process) influence how you approach projects, especially when dealing with complex or evolving datasets?
10.12 Reproducibility and Ethical Considerations
As data science projects scale, reproducibility ensures others can verify and extend your work. Following best practices—organising projects (Lab 4), tidying data (Lab 5), and documenting code—is vital. Moreover, ethical considerations (privacy, bias mitigation, fairness) must be integrated into every stage of the data science lifecycle.
Reflection Question 10.8
How can establishing reproducible workflows and considering ethical guidelines early in a project help maintain trust and credibility in your analyses?
10.12.1 Practice Quiz 10.1
Question 1:
Data science is considered interdisciplinary because it involves the integration of:
- Mathematics, domain expertise, and biological sciences
- Programming, mathematics/statistics, and domain expertise
- Philosophy, ethics, and data engineering
- Chemistry, physics, and computer science
Question 2:
The iterative nature of the data science lifecycle is essential for:
- Ensuring a one-time solution
- Continuous refinement and improved insights
- Avoiding communication and visualisation steps
- Reducing time spent on data wrangling
Question 3:
In the context of anomaly detection, which of the following scenarios is most relevant?
- Predicting future sales
- Identifying fraudulent transactions
- Recommending products to customers
- Forecasting weather trends
Question 4:
Why is domain expertise considered critical in data science projects?
- To eliminate the need for reproducible workflows
- To ensure analyses are contextually accurate and meaningful
- To substitute for statistical reasoning
- To automate the cleaning process
Question 5:
Which of the following ethical considerations is essential in data science?
- Automating decision-making without human oversight
- Mitigating bias and ensuring fairness
- Replacing statistical methods with machine learning
- Eliminating reproducibility for scalability
Question 6:
In the healthcare analytics example, the role of predictive modelling primarily involves:
- Replacing clinicians in decision-making
- Identifying trends in patient demographics
- Predicting patient readmissions and improving care
- Tidying and transforming hospital data
Question 7:
During the “Tidy” phase of the data science lifecycle, what is the primary goal?
- Creating dashboards for analysis
- Organising data into a structured format for analysis
- Designing machine learning models
- Cleaning visualisations for stakeholder presentations
Question 8:
Which stage of the data science lifecycle involves crafting visual narratives to interpret results?
- Model
- Transform
- Visualise
- Import
Question 9:
Why is the “Communicate” phase considered critical in the data science lifecycle?
- It automates repetitive data cleaning tasks
- It presents findings clearly and persuasively to stakeholders
- It eliminates the need for statistical reasoning
- It directly replaces the “Model” phase
Question 10:
How does viewing data analysis as a cyclical lifecycle benefit complex projects?
- Reduces the need for domain expertise
- Supports iterative refinement and evolving datasets
- Guarantees fixed solutions for all analyses
- Simplifies reproducibility without documentation
10.12.2 Exercise 10.1: Identifying Data Science Roles
Task: Suppose your team includes a statistician, a software engineer, a business analyst, and a machine learning researcher. Discuss how each role contributes to a data science project to predict hospital readmissions. Reflect on what gaps remain if one role is absent.
Reflection Question (for Exercise 10.1)
How does the presence (or absence) of specific skill sets within a data science team shape the quality and scope of the project’s outcomes?
10.12.3 Exercise 10.2: Mapping Lab Skills onto the Data Science Lifecycle
Task: Revisit Labs 1–6 and identify how each set of skills (e.g., reproducible workflows, data wrangling, visualisation) maps onto the stages of the data science lifecycle. For instance, where does your expertise in dplyr fit, and how does your mastery of ggplot2 support the Communication stage?
Reflection Question (for Exercise 10.2)
Does visualising how your learned skills align with each lifecycle stage help clarify your long-term development path as a data scientist?
10.12.4 Exercise 10.3: Designing a Mini Project
Task: Think of a small data science project you can undertake (e.g., analysing weather data to predict rainfall patterns). Outline which data you will import, how you will tidy and transform it, what models you might apply, and how you will visualise and communicate results. Consider missing data, how you would handle it, and potential ethical implications (e.g., data privacy, sensitive attributes).
Reflection Question (for Exercise 10.3)
How does planning a mini project from start to finish help consolidate your understanding of the data science concept and lifecycle?
10.13 Reflective Summary
In Lab 10, the techniques learned in earlier labs—such as reproducible workflows, data wrangling, and data visualisation—are contextualised within the comprehensive data science framework.
Key Takeaways:
Definition and Scope: Data science is interdisciplinary, drawing on multiple fields to solve complex, real-world problems.
Applications and Use Cases: Data science drives innovation in forecasting, pattern detection, recommendation systems, anomaly detection, and more.
Data Science Roles and Skills: Successful data scientists blend programming, statistics, domain knowledge, and communication skills.
Data Science Lifecycle: Projects evolve through importing, tidying, transforming, modelling, visualising, and communicating results.
Integrating Previous Skills: The workflows, data wrangling, and visualisations learned in earlier labs form essential components of the data science process.
As you move forward, remembering the holistic nature of data science ensures that each skill—be it project organisation (Lab 4), data wrangling (Lab 5 & Lab 6), or visualisation (Lab 7)—contributes to a cohesive, meaningful analytical journey. Data science is not merely about tools or techniques; it’s about asking the right questions, navigating complexities, and conveying insights that drive informed decisions and positive change.
What’s Next?
In the next lab, Use Case Projects, you’ll integrate these skills to tackle real-world problems. You’ll design end-to-end workflows that turn raw data into actionable insights, demonstrating how each component of your training comes together in practical, impactful applications.
Davenport, T. H., & Patil, D. J. (2012). Data scientist: The sexiest job of the 21st century. Harvard Business Review, 90(10), 70–76. https://hbr.org/2012/10/data-scientist-the-sexiest-job-of-the-21st-century↩︎
Wickham, H., Çetinkaya-Rundel, M., & Grolemund, G. (2023). R for data science (2nd ed.). O’Reilly Media. ISBN: 978-1-4920-9740-2. Retrieved from https://r4ds.hadley.nz/↩︎